A Look at Traffic

Case studies to allow an analysis of traffic.
Showing posts with label Traffic. Show all posts

Monday, July 9, 2012

Help! - Highway Traffic Edition

In the year 2012 A.D. highway dynamics appears to be a result of individual drivers simply trying to minimize their travel time and drive in a way that only benefits them. This is known as User Equilibrium solution, because it creates a condition on the roadway that stabilizes to a point where every user achieves about the same efficiency, with nobody receiving an unfair advantage. If some users are willing to let others cut in front of them or allow others to take a faster route, these maneuvers could result in an overall increase in travel time for the local highway network. If all vehicles follow rules to overall reduce the travel time on the highway, this is described as a System Optimal solution to the highways. It should be of no surprise that a system optimal scenario rarely happens on roadways. This will hopefully change!


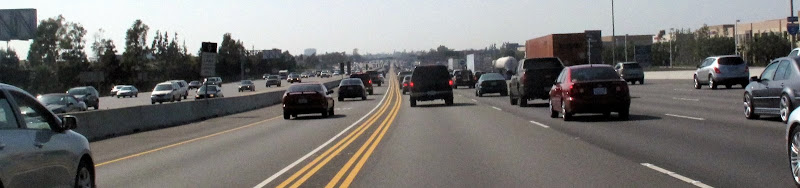
I bring up these two types of traffic dynamics because the other day, on my bike ride home, I saw a situation on the highway that deeply bothered me as an extreme example of User Equilibrium case of traffic. The situation on the highway was this:
            A car was stopped in one of the middle lanes of the highway while backed up cars behind it were just driving around it to continue on their journey. A picture of this event was captured, see below.

It made me think that if there were all pedestrians walking, that a fellow human being would stop and assist the person blocked in the middle of the street/sidewalk. Bicyclist too, I would assume, help out a fellow rider. But instead, in a car, we all have enclosed boxes around us that help us ignore our surroundings and other ‘future friends’ who maybe in need of some assistance. 


A helping hand in this type of situation wouldn’t only be generous of time and talent, but it would also help clear the roadway of the traffic slowing down miles of cars upstream. A few minutes helping the jammed car (and scared/frustrated driver) could save hundreds of minutes or more on their commute home! It’s as if the protocol for a ‘citizens arrest’ were applicable for a highway collision here, except it would be called a ‘citizens AAA rescue’. A few blocked lanes, a couple dedicated drivers willing to help, should be able to assist the driver to the side of the road for safety and in an effort to speed up the capacity of the roadway within a matter of a few minutes. The technical details of how drivers would block all lanes, and convince other drivers to hold their horses is still a mystery and safety issue, but solving that would greatly enhance the roadway conditions during a breakdown.

The efficiency of the highway in this situation was greatly reduced to its optimal/maximum throughput, and spending a few minutes to fix the heart of the problem would increase safety and reduce travel time for travelers. It’s soo evolutionary to be like ant’s and just go around the problem, even though it’s causing major delays for everyone behind them.

I want to diverge a bit and continue on the above mentioned thought about cars isolating people and putting them in boxes. A singled passenger in a car creates a little bubble for drivers that distances them from the outside world and fellow travelers. Of all the damage that a car does, I feel this is by far the worst! It’s not necessarily an effect to be seen over night, but rather one that happens over a long period of time. This distancing effect is also prelvant in other areas of our lives. Scary, yes! While convertibles or Limousines, may seem to help the problem, they only provide a drop in the bucket solution to this larger problem at hand. So how do we really take the issue? Here are a few of off-the-cuff ideas to mix things up:

  • ·         Take public transit, Active transportation – Start conversations with people on public transit or on bike trails near you. Meeting ‘future friends’ is perfectly normal after  it’s done a few times.
  • ·         Roll down your windows and wave to people when driving. Smile and startconversations with people at red lights.

Now back to the main issue in this post, transit operations have a slew of dedicated professional monitoring the transit network, and yet vehicles have nothing of the sort to help clear the highways. If a monitoring system (or crowd sourced solution) on the highways could help dispatch a tow truck to a driver in need to help solve a slowdown, the freeways would  operate at a higher capacity and people would be more likely to drive on the same route again tomorrow!

Hopefully we can develop a solution and take action before we pass another stranded car in the middle of the road, or a person needing help on the side of the highway.

Read more...

Tuesday, March 6, 2012

All About: Intersections - Part 1 of 2


I believe that in transportation, some of the really interesting things happen when things come together. Literally! Grand Central for example is a crazy happening place simply because of all the transportation modes that feed to one location. In an Auto network we see this occur a lot more frequently at Intersections. Two streets crossing requires a safe and effective means for all vehicles to travel safely in their intended direction. I see the intersection as a market place where people come to share time together before they continue on their journey. For large intersections this requires money (~$200,000+ (2011)), advance planning, engineering, and important technology to keep drivers happy. In this first post of a two part series, I want to layout three aspects of basic traffic elements of an intersection that keep cars, pedestrians and Bicyclists moving.

Pedestrian Crossings/ Bike Buttons

Facilitating the movement of pedestrians is also a key component of a safely operating intersection. Typically pedestrian buttons and signs give walkers, joggers and dog walker’s informative information about the traffic signal and green directions. More commonly today, these facilities are being upgraded to have audio chirps, tactile padding, and large “mushroom” buttons. All of these features are synergized together to make a pleasant walking environment for pedestrians.

In addition to these pedestrian improvements, bicycle buttons have been added on the outward facing pole to give “in-gutter” bikers the ability to request a crossing. One major difference between his button and a pedestrian button is the amount of time allocated for each button to cross the street. A pedestrian button can give 20 to 30 seconds, while a bike button would give the same amount of time as a single vehicle to cross the intersection. This helps the efficiency of the intersection and prevents too much time given to pedestrians who won’t use it.

More recently we have seen bicycle detectors in the bike lane on the ground. Similar to a vehicle inductance loop to detect a car, these bicycle loops are sensitive enough to detect a bike moving over the loop. While these are yet to be perfect, depending on the mass and material of the bike, they have helped bicyclist automatically interact with the intersection, the only issue still seams to be detecting carbon fiber bikes. Solving this could lead to a huge jackpot for entrepreneurs. With bike detection becoming more common, I can only hope we begin to see bike signal coordination to allow bicyclist to have a pleasant green light stroll the same way cars do!
Vehicle Detection
Traditionally, a fixed time is allocated for each traffic direction no matter how many vehicles line up at each approach. The downside of this, is that it can waste time by giving a green light to a direction without any vehicles waiting. To solve this, wires have been put in the ground in the shape of a circular loop to detect vehicles. These are typically placed closest to the crosswalks to capture the first few row of vehicles.
Installation of these wires requires lane closure to make cuts in the pavement, allowing for the wire to be dropped inside, and then a sealant is placed over the cut to securely embed the wire in the ground. All the wires from the different lanes are pulled to the side of the road into what is known as a pull box, and fed into a traffic cabinet on the side of the road. Electric current  is run through the wires and when a large metal object (like a car) hovers over the wire, the change in current is measured and a vehicle is detected.

Cycle Length
Besides some of the physical geometries of an intersection signal, we can also consider the underlying operation of how a light changes between red, yellow and green for the different movements. No matter how the intersection is set up, a signalized intersection typically operates on a cycle length. A cycle length is simply the amount of time given to have a green period for all the different movements of traffic. Typically a cycle length varies from 60 seconds to 2 minutes depending on the size and amount of vehicles using the intersection.
The cycle length is determined by the traffic engineers either manually or via computer programs for optimization purposes. This and all the other relevant information of a traffic signal is stored on signal timing charts with the city. Through a public records request, anyone can request this information and use it for their own purposes (usually Traffic Engineering Consulting firms will request this from cities when performing a project dealing with the city signals). In addition to cycle length these charts provide NEMA phase information, green, yellow and red times, as well as time of day charts to show when a cycle length may change during the day based on historical demand traffic volumes.

I hope this has outlined some of the basic characteristics of an intersection and provided relevant information for your next encounter with one (hopefully on a bike!). In my next segment focused about intersections, I plan to explore information about signal coordination and optimization and give some ideas for future intersection technology.

Continue Reading Part 2 of 2.
Read more...

Tuesday, December 6, 2011

Highway Traffic Congestion Solved: Queuing Lot’s


Traffic jam’s are a common occurrence in California (among other states), where vehicles are plenty and roadways are never wide enough. Slowly but surely we are seeing parking lots creep into our highways. There has to come a point where eventually something must change. While we may not know what that “something” is, I want to outline a possible idea that could help reduce highway congestion, frustration, and save money/gas/emissions for drivers.


 Traffic Congestion - Highways turning into Parking Lots
Before I dive into the explanation about this Queuing Lot idea, I need to outline some basics of a highway operational facility. A typical one lane highway road, can efficiently provide uncongested service for about 1,800 vehicles per hour. (some say 1,500, and others say 2,200, but we’ll stick with 1,800). Using loop detector data collected from the highways, we can see that this approximation holds by looking at a Performance graph of two highway measurements.


Flow v.s. Occupancy Curve - Classic shape of vehicles becoming congested on highway. Green line - Free Flow, Red - Maximum Capacity of Roadway - Slowing speeds, Yellow - Highway Breakdown


On the Vertical y-axis we see Flow (veh/5 min) and on the horizontal x-axis, we see Occupancy (%). Occupancy can easilstly thought of as “density” or how closely spaced the vehicles are. A Occupancy of 1.0 (ie. 100%) would be where all the vehicles on the road completely stopped like a parking lot taking up every inch of the pavement.


Before we move on, it’s important to look at the shape of this flow-occupancy curve. From just looking at it, we can see that the number of vehicles increases as occupancy/”density” increases almost in a linear fashion [Green Line], until it reaches a certain value. We start to see a maximum flow [Red Line] occur and then a tapper-off effect and a decrease in the flow of vehicles as occupancy continues to increase [Yellow Arrow]. From this we can assume there is a maximum peek value that has an efficient use of vehicles traveling on the roadway segment. Ideally, to keep traffic flowing and having the highways transporting the maximum number of vehicles possible, we want to restrict the number of vehicles on the roadway segment to a specific value. For this highway segment it turns out the capacity is 1,800 vehicles per hour per lane.

For a highway segment that is only connected to on and off ramps with metered controls. Highway ramp meters have been shown to be more effective then ineffective (Study 1, Study 2, Study 3).Typically ramp meters delay vehicles entering the highway for a few seconds to keep the highway from overcrowding, while also not letting the on-ramp build up to the arterial streets with vehicles. Ideally each vehicle would wait their full marginal delay time before entering the freeway. This is where Queuing Lots come into play.

Waiting lots at airports or other transportation hubs, sometime’s called kiss-and-ride lots or Cell-Phone waiting lot, are a common effective solution for vehicles waiting to pick up their passenger(s). The idea behind Queuing Lots ©, is similar, allowing the driver to relax and wait, while keeping vehicle traffic on the highway operating at the maximum throughput possible. One way this could work, is when the highway is near peek capacity [Red Line], drivers entering the on-ramp would be diverted to a Queuing Lot, where they are assigned a designated amount of time to wait, until they can enter the highway. Depending on the amount of traffic, point of entry, point of exit, etc. a wait could be a few minutes or 20(+) minutes. In the Queuing Lot, drivers are free to turn off their car and make phone calls, listen to the radio, text message, shave, dance, etc. Once your time is up, your free to merge on the free-flowing highway.


This concept could be applied via a ticket system or phone application that would require a ticket when entering the highway or a toll if not allowed with ticket at that time.


Modeling this type of traffic behavior would be the most cost effective way to determine if this would reduce travel times overall. A real time monitoring and performance evaluation system would need to be continually adjusting for the optimum wait time for drivers. As for the emissions, frustration, gasoline and wear and tear savings they are straight forward.

The biggest downfall of Queuing Lots: Trying to get somewhere, when your parked in a actual parking lot.

Read more...

Friday, February 26, 2010

3 Hours of Video - All about Traffic

Today I wanna share with you two videos that talk about some of the truly interesting aspects of traffic. This first video is a round table discussion of professors who are all very well educated. They give a nice perspective from multiple disciplines which makes for an interesting round table. The video can be seen here:
http://www.youtube.com/watch?v=ux3BjI3WYs0 (1hr, 50 min)

The Second video is by the author of a book called Traffic: Why we drive the way we do ([1][2][3]). It is part of the Authors@google talks. He presents some fascinating features of traffic. His book follows along the same line of the talk, so if you can't get enough, I recommend checking out the book!


I hope these videos can begin to show the need for inter-diciplins to get together and work towards a solution.I belive a diverse group of individuals from all areas, is a step in the right direction to help deal with this traffic problem.

Read more...

Thursday, May 7, 2009

405 Northbound - Monday V.s Friday Traffic Comparison

Looking at the 405 Northbound Highway between Sand Canyon Ave and Jeffery Ave on Monday May 1st and Friday May 4th 2009, I found that this particular highway segment was interesting to look at, due to heavy traffic volumes in both the Am and Pm hours.
View Larger Map


Comparing the morning and evening times for Monday and Friday, we can draw some heavy conclusions about when people are leaving and getting on the road. The data has been collected from loop detectors on the highway, which I extracted using PEMS. I then looked at the Flow (vehicle/time) and speed(mph). The data is grouped into 5 minute intervals for the highest resolution avalable from PEMS. Before we look at the data plots, I would like to say that the more flow on the highway, resulting in more cars on the highway, which should reduce our speeds. Keep this in mind when looking at the graphs. The Flow was calculated as an average of all the lanes, thus giving one line in the graph, rather then four flow lines for four lanes. I left each of the lane speed data in there respective colors to give insight into the faster and slower lanes (More on this in another article).


Monday Flow and Lane Speeds

Key: Purple - Average Flow over all the lanes. Blue - Lane 1 (Inside lane next to divider). Red - Lane 2. Yellow - Lane 3. Green - Lane 4 ("trucking lane").


Friday Flow and Lane Speeds


Key: Purple - Average Flow over all the lanes. Blue - Lane 1 (Inside lane next to divider). Red - Lane 2. Yellow - Lane 3. Green - Lane 4 ("trucking lane").


Key: Blue - Monday. Red - Friday.

Here it seams the data is telling quite a compelling story. The flow on each of these days, rises quite rapidly in the morning time, but notice that the peek flow occurs 40 minutes apart on each of these days (6:45am on Monday and 7:25am on Friday). I believe this 40 minute time gap can best explained by the majority of cars on the road ways are people going to work. Mondays are a great day to kick off the week, and it seams most people try to start the week off right by trying to get to work early or on-time. Another interesting point of note, is the leaving times in the afternoon on both these days. On Monday we see people stay off the roads for a bit longer then on Fridays. Mondays peek Flow is seen at 5:10 pm. Friday however, we see a triple peek; Once at 2:45 (slackers), 3:40 (conservative effort workers) and again at 5:20 ('Over time' Workers). Overall the peeks occur earlier on Fridays then they do on Monday. The peeks are also more amplified on Friday, then they are on Monday.

Notice: the leave time in general is much more scattered, as people can usually leave there "work" at a more flexible time, then when they must arrive.

Assumptions: This is only for one highway, at one location on the highway, during one Monday and one Friday, However this is going to be true in all highways all across the world.


Read more...

About This Blog

This blog is to allow for case studys to begin studying traffic.

  © Free Blogger Templates Photoblog III by Ourblogtemplates.com 2008

Back to TOP