This wouldn't be a very good transportation blog, if it didn't cover one of the best things to hit California since the Gold Rush. That's the Megabus! This thing is awesome and I love riding it!! Efficient, cheap and with expanding destinations. The East Coast has known Megabus for a while now, but only recently (Dec. 12th 2012) have we seen Megabus come to California's Union station, SF, Oakland, and others! This blog post is intended to show you some tips and tricks about Megabus so you can be well informed with the knowledge you need on your next trip!
 |
| This double decker Megabus take a night stop off I-5 for people to stretch their legs, grab a bite to eat and use the restroom. |
Buying your Ticket and Boarding
To ride megabus, it requires pre-booking on their website:
www.megabus.com. Buy your ticket online and confirm you get a text message or email of your boarding number. It's a long number/dash/Letters kinda thing. It looks something like this:
10-6828-094042-M10-0654-SFR-LOS
Those last letters show the origin and destination location (S.F. and Los Angeles in this case), the other numbers are still a mystery. From my experience, 90% of passengers have their "boarding number" sent via text message to their phone or email, leaving them to look up the number on their phone at boarding time. I prefer to write the boarding number down on a piece of paper. Simple, like a ticket, won't run out of batteries, and quick to pull out of my pocket.
The more advance you can buy the ticket, the cheaper it is (like an airlines). When a bus fills up, you can't buy any more tickets anymore. Buses hold about 62 passengers (+2 drivers). If you are the first one to book a ticket, it costs $1 (+.50 cent fee). Then it jumps up pretty quickly. LA-SF is usually $35-$40. If you compare this to
ZimRide, for the same route, it's comparable. Except that
ZimRide is probably more direct, if not door to door. Megabus does have a wonderful effect for being a long range, low cost bus service operator in
areas of need!
Choosing a Seat
Most Megabus buses have a nice spacious, conversation friendly environment on the lower level. If you are in a group of 3+, try to snag this area. If you are traveling alone or with one other person, upstairs works pretty well. If you are one of the firsts to board, you will have a option of a window seat upstairs, or an aisle seat. The window seat gives better views, something to lean on for napping, and leaves it up to fate for who will sit next to you (Once I saw a guy sitting in the aisle fall asleep and lean on the guy sitting in the window sleep. This was not a pleasant experience) . If you choose an aisle seat (by choice, or availability), you will be able to stretch your your legs into the aisle a bit and have easier access to get up for a bathroom break (don't forget to lock the door in the bathroom). From my experience, early morning buses are usually less full than evening buses. Also some window seats have the ability to recline further than normal. Like obnoxiously far back if someone is sitting behind it.
The Ride
Below and between the two seats is a outlet for plugging in your electronic device. This works really well. Above is a bright reading light for use if the person next to you does not mind (these lights are not as focused as the airplane lights) and a stop button in case of an emergency.
For some reason, the thermostat on Megabus, day or night, is set to a uncomfortably low temperature. They are unable to adjust it, so dress warmly! 2 layers with a sweatshirt and beanie/head covering is not excessive to be comfortable. I remember looking at some passengers on a night bus ride, and they had a blanket completely covering their head and body to fall asleep under. So take note, warm clothes, sweatsh
irts, beanie, blankets and even neck pillows are all highly recommended!
The seats are nicely covered in some sort of fabric, with a decent amount of cushion, but after 6 hours, they become a bit uncomfortable. However, what seat wouldn't be.
 |
| Inside a Megabus, notice the 'hip' neon green light to illuminate the bus at night. Don't forget to buckle your seat belt! |
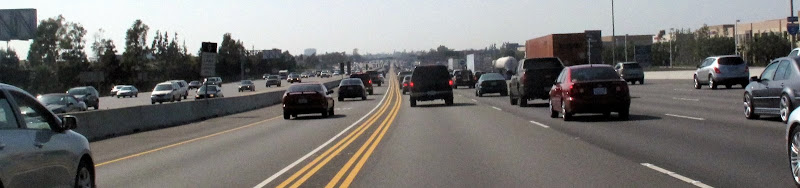
In California from
Union Station to SF/Oakland/SJ, the Northbound
bus typically stops
here. On the trip south, the Megabus usually stops in
this parking lot, and it usually stops long enough for you to run across the street to the
Subway to get a sandwich. Oh, and they do a count on the bus before they leave to make sure everyone is there, so you shouldn't have to freak out.
Let's be honest, the
Megabus Wifi sucks!! Kiss that Netflix movie stream goodbye! I did connect to it before and it was great for 5 minutes, and then it didn't want to establish a connection. Other times it never connected. If you have data on your phone, don't waste your time with the Wifi! Just for the record, they do have a Wifi signal on the bus, but whether it actually connects to the internet is hit or miss, and it's usually a miss!
So what do people usually do on the Megabus? The #1 thing is probably sleep. If not sleeping, social media is a great time waster while on the bus. If you have some specific complaints about your Megabus ride, there is a group for you on twitter for you to tweet to;
@megabusfail. You can see the common complaints on there have been addressed above!
 |
| Passengers board outside of the West Oakland BART station. It's handy to have your boarding # and luggage ready for quick and efficient boarding |
The Megabus provides a great opportunity for Art and photography. One one ride, I saw a guy take out his DSLR and snap a wonderful sunset shot over the rolling hills to the West of
I-5. He didn't mind completely turning around in his seat to prep the shot and snap it.If I had a camera I would have been taking the shot also! On a different trip, I snapped the picture below off
State Route 152.
 |
| View of Pacheco lake off of Pacheco pass on SR-152 |
In talking with a friend about the Double Decker Megabus, he suggested I try to get a front row seat and capture some pictures for a timelapse. I was able to follow through in this and setup a
GoPro camera on my shoe to take pictures every 2 seconds. The video of these pictures stitched together can be seen below!
Concluding Thoughts
I hope this demonstrates why Megabus is awesome!!! Just be sure to check for updates on the megabus website about where stop changes occur so you don't miss your bus! I hope this has helped plan for your trip and everything goes smoothly!
Safe Travels Amigo!
Read more...

.png)


