Highway Traffic Congestion Solved: Queuing Lot’s
Traffic
jam’s are a common occurrence in California (among other states), where
vehicles are plenty and roadways are never wide enough. Slowly but surely we are seeing parking lots creep into our highways. There has to
come a point where eventually something must change. While we may not
know what that “something” is, I want to outline a possible idea that could help reduce highway congestion, frustration, and save
money/gas/emissions for drivers.
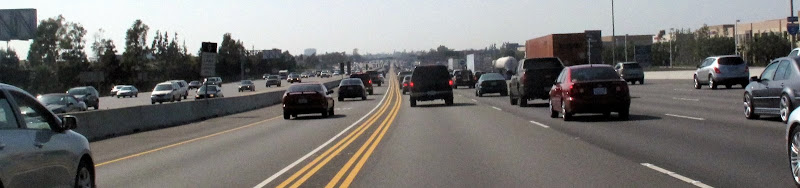
| Traffic Congestion - Highways turning into Parking Lots |
 |
| Flow v.s. Occupancy Curve - Classic shape of vehicles becoming congested on highway. Green line - Free Flow, Red - Maximum Capacity of Roadway - Slowing speeds, Yellow - Highway Breakdown |
On the Vertical y-axis we see Flow (veh/5 min) and on the horizontal x-axis, we see Occupancy (%). Occupancy can easilstly thought of as “density” or how closely spaced the vehicles are. A Occupancy of 1.0 (ie. 100%) would be where all the vehicles on the road completely stopped like a parking lot taking up every inch of the pavement.
Before we move on, it’s important to look at the shape of this flow-occupancy curve. From just looking at it, we can see that the number of vehicles increases as occupancy/”density” increases almost in a linear fashion [Green Line], until it reaches a certain value. We start to see a maximum flow [Red Line] occur and then a tapper-off effect and a decrease in the flow of vehicles as occupancy continues to increase [Yellow Arrow]. From this we can assume there is a maximum peek value that has an efficient use of vehicles traveling on the roadway segment. Ideally, to keep traffic flowing and having the highways transporting the maximum number of vehicles possible, we want to restrict the number of vehicles on the roadway segment to a specific value. For this highway segment it turns out the capacity is 1,800 vehicles per hour per lane.
For a highway segment that is only connected to on and off ramps with metered controls. Highway ramp meters have been shown to be more effective then ineffective (Study 1, Study 2, Study 3).Typically ramp meters delay vehicles entering the highway for a few seconds to keep the highway from overcrowding, while also not letting the on-ramp build up to the arterial streets with vehicles. Ideally each vehicle would wait their full marginal delay time before entering the freeway. This is where Queuing Lots come into play.
Waiting lots at airports or other transportation hubs, sometime’s called kiss-and-ride lots or Cell-Phone waiting lot, are a common effective solution for vehicles waiting to pick up their passenger(s). The idea behind Queuing Lots ©, is similar, allowing the driver to relax and wait, while keeping vehicle traffic on the highway operating at the maximum throughput possible. One way this could work, is when the highway is near peek capacity [Red Line], drivers entering the on-ramp would be diverted to a Queuing Lot, where they are assigned a designated amount of time to wait, until they can enter the highway. Depending on the amount of traffic, point of entry, point of exit, etc. a wait could be a few minutes or 20(+) minutes. In the Queuing Lot, drivers are free to turn off their car and make phone calls, listen to the radio, text message, shave, dance, etc. Once your time is up, your free to merge on the free-flowing highway.
This concept could be applied via a ticket system or phone application that would require a ticket when entering the highway or a toll if not allowed with ticket at that time.
Modeling this type of traffic behavior would be the most cost effective way to determine if this would reduce travel times overall. A real time monitoring and performance evaluation system would need to be continually adjusting for the optimum wait time for drivers. As for the emissions, frustration, gasoline and wear and tear savings they are straight forward.
The biggest downfall of Queuing Lots: Trying to get somewhere, when your parked in a actual parking lot.
0 comments:
Post a Comment